
Overview
Clustering is basically a type of unsupervised learning method. An unsupervised learning method is a method in which we draw references from datasets consisting of input data without labeled responses. Clustering is a technique that groups similar data points into groups based on their similarities or distance from each other. The classification into clusters is done using criteria such as smallest distances, density of data points, graphs, or various statistical distributions.
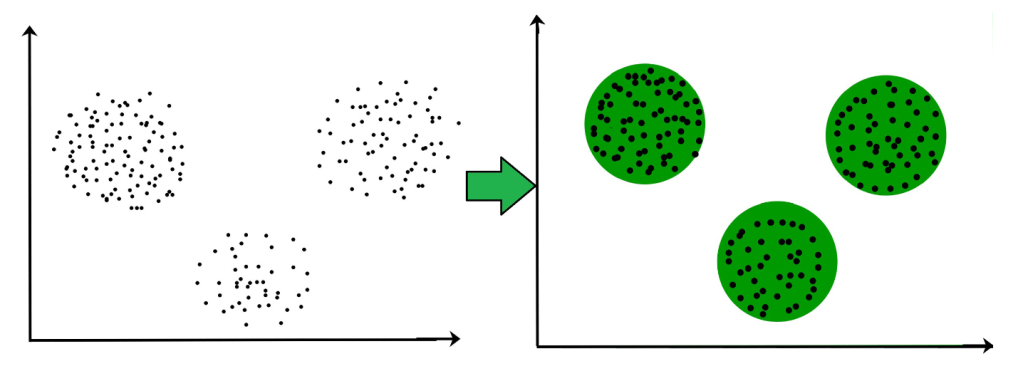
For example, the clustered data points in the graph below can be categorized into a single group. In the figures below, the clusters can be distinguished, and we can count three clusters.
Partitional Clustering
Partitional Clustering divides data objects into nonoverlapping groups. The key point is no object can be a member of more than one cluster and every cluster must have at least one object. This algorithm requires specifying the number of clusters. Many partitional clustering algorithms work through an iterative process to assign subsets of data points into k clusters. This method is used to optimize an objective criterion similarity function such as when the distance is a major parameter.
One of the most commonly used partitional clustering methods is the k-means clustering. K-means partitions n observations into k clusters where each observation belongs to the nearest mean cluster. It aims to determine the centroids that classify each cluster meaningfully regarding the positions of samples.
K-means clustering consists of 4 steps:
- Initializing with randomly chosen k centroids which are data points representing the center of a cluster
- Assigning each data point to its nearest centroid according to the euclidian distance
- Calculating the mean of all the points for each cluster and moving the centroids to these means
- Repeating steps 3 and 4 until the centroid positions do not change
The partitional clustering method used for this analysis is k-means clustering coded in Python using the sklearn package. The data used in this method is numeric data where every row represents a different song and the columns represent the audio features. The goal with the k-means clustering is to use a clustering algorithm to break down a large playlist into smaller ones and to recommend the best songs for users.
Hierarchical clustering
A Hierarchical clustering method groups data into a tree of clusters. The aim is to produce a hierarchical series of nested clusters. This clustering is divided into two types which are agglomerative and divisive. Agglomerative is a method of merging smaller clusters into larger ones. However, divisive is to break up larger clusters into smaller ones. Each data point is initially treated as an independent cluster, and from there, the algorithm iteratively aggregates the nearest clusters until a stopping requirement is met. The result of hierarchical clustering is a tree structure called a dendrogram which represents the hierarchical relationship between clusters.
The algorithm of agglomerative consists of 4 steps:
- Starting as an individual cluster called singletons in each item within a dataset
- Computing the proximity amongst each cluster
- Merging each pair of clusters and calculating the new proximity amongst remaining clusters
- Repeating the process until there is one cluster left
The hierarchical clustering method for this analysis uses the hclust package in R. The data used in this method is the same data as the k-means clustering. The data preparation below will show more about the data being used.

Data Preparation
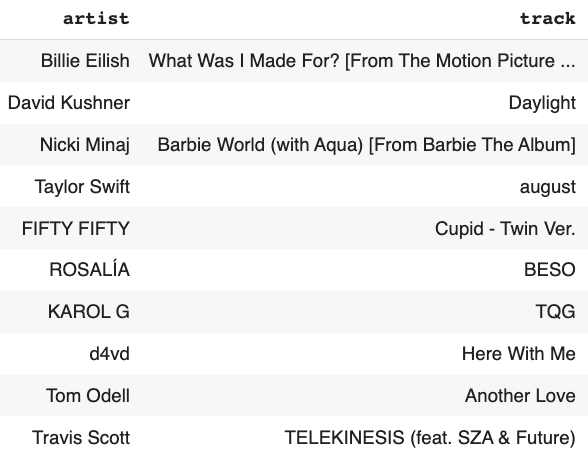
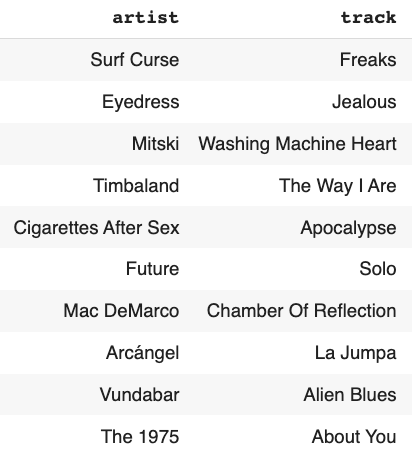
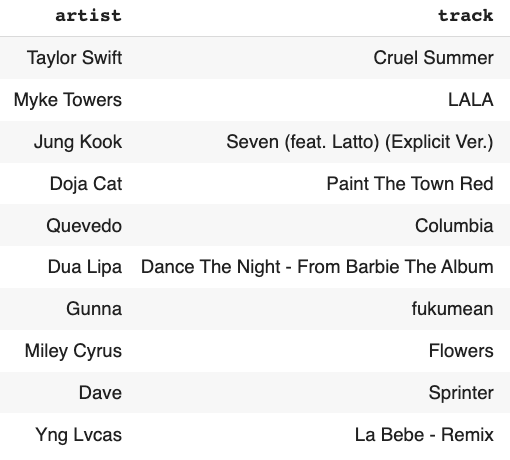
The data used for clustering analysis is Spotify data. Every row represents a song and every column represents audio features in each song.
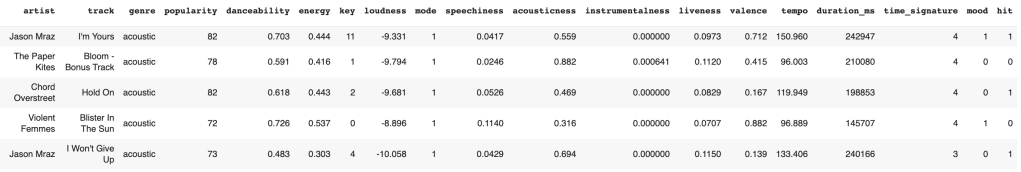
However, in order to do clustering, it requires unlabeled data and the data must be normalized before analyzing. It is the process of transforming the data into a standard format or scale to remove variations caused by differences in units, scales, or the magnitude of the data. Normalization ensures that all features are on a consistent scale, preventing certain features from dominating others during analysis. To normalize this Spotify data, a normalization technique, min-max scaling, would be applied to bring all these features to a standardized scale such as 0 to 1, making it easier to compare and analyze them.
To normalize data
- Identify the variables for normalization
- Calculate the minimum and maximum values for each variable in the dataset
- Apply min-max scaling
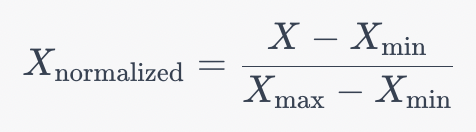
Where Xmin is the minimum value of the variable and Xmax is the maximum value of the variable.
4. Replace original values with normalized values in the dataset
The figure below is the unlabeled data which is normalized.

Once the data is normalized, it is ready to move on to k-means clustering. However, for hierarchical clustering, creation distance matrix is required.
For hierarchical clustering, the data was analyzed in R. The data used to create the distance matrix is the same as in the k-means clustering method above. To calculate the distance metric called cosine similarity, the Proxy package in R is called. It is a metric commonly used to measure the similarity between two non-zero vector in a multidimensional space.
Result
K-Means Clustering
To implement k-means clustering, a certain number of clusters, which distinctly split the data, have to be selected. The elbow method is one of the methods created to define the number of clusters. It will calculate the within cluster sum of squares (WCSS) for varying numbers of clusters from 1 to 14. Withing cluster sum of squares is the sum of the squared distance between points and the clusters. The plot below is the elbow plot created.
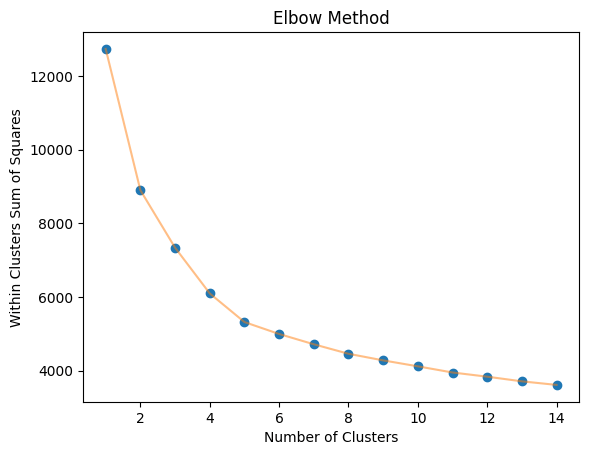
From the plot, it can be determined that the optimal number of the cluster is 4. However, to confirm the optimal number of clusters, the silhouette score should be considered as well. It is a metric used to calculate the goodness of a clustering technique with the range from -1 to 1.
1: Clusters are well apart from each other and clearly distinguished
0: The distance between clusters is not significantly different. It means that the clusters are indifferent.
-1: Clusters are assigned in the wrong way
After calculating the silhouette scores and plotting the scores in each cluster, the figure is shown below.
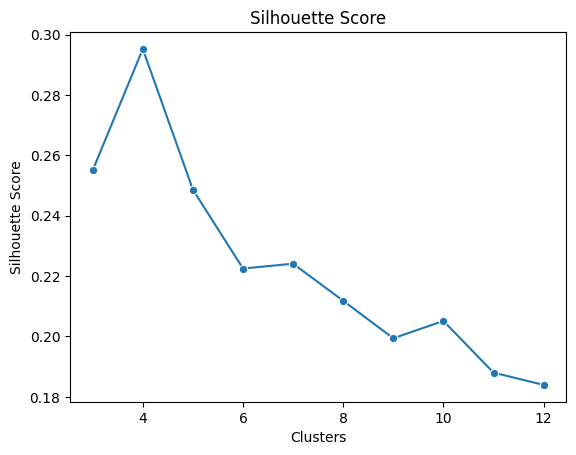
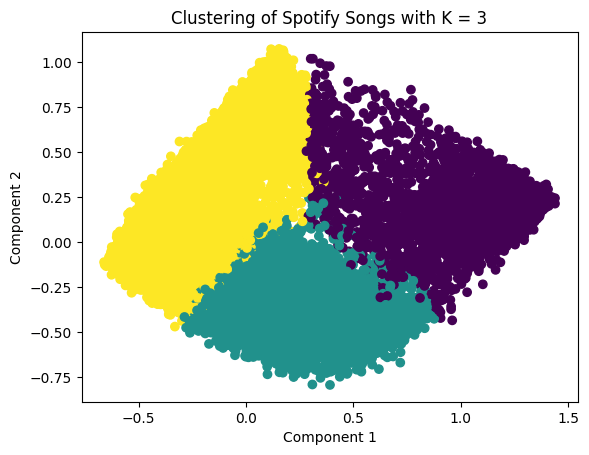
It can be seen that the maximum silhouette score is at k equal to 4 which means that 4 clusters is the right option. Therefore, the Spotify data can be separated into 4 clusters. Moreover, to visualize the generated clusters, reducing the data to two dimensions is needed, so that a scatter plot can be created by using a PCA model with two components. PCA facilitates the visualization of complex, high-dimensional data in a lower-dimensional space (usually 2D or 3D). By plotting the data based on the first few principal components, patterns and structures that are not easily discernible in the original high-dimensional space become more apparent. It can aid in clustering and classification tasks by transforming the feature space into a more informative representation. Clustering and classification based on principal components can often lead to improved accuracy and efficiency. Below is the scatterplots compared between k = 3, 4, and 5 respectively.
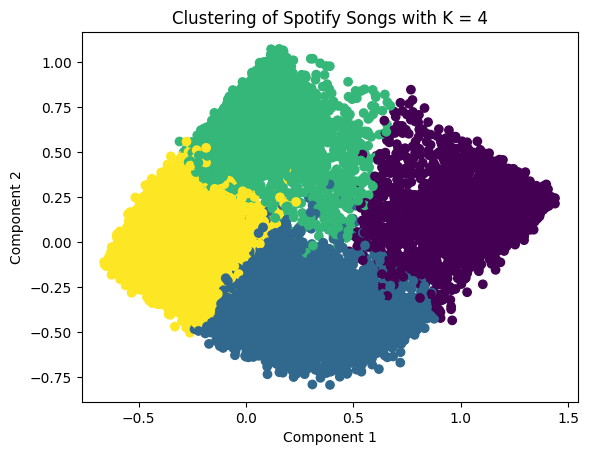
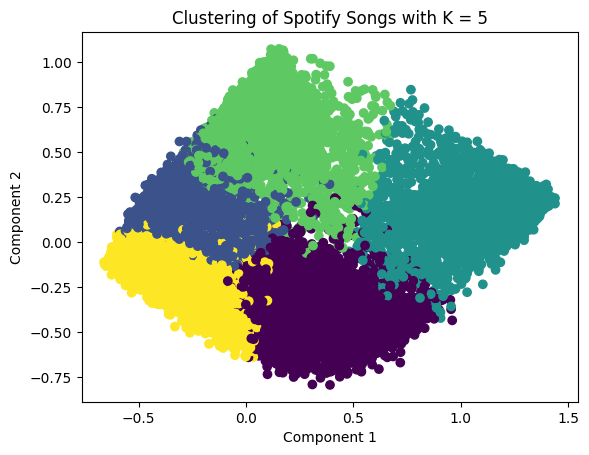
However, the appropriate number of clusters is equal to 4. Looking at the deep detail in each cluster:
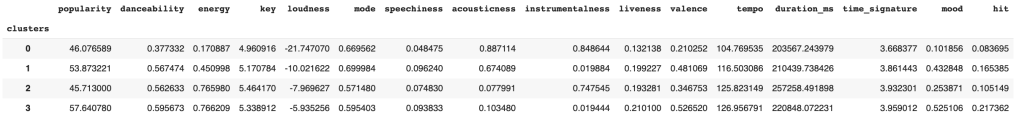
Cluster 0

It contains less energetic songs but high acousticness. Moreover, these songs are a little sad and gloomy. However, the songs have a lot of instrument sounds.
Cluster 1
As per features, it contains less energetic songs with high acoustics but less instrument sounds. In addition, these songs have neutral lyrics.
Cluster 2
As per the features, cluster 2 contains high energy values with high instrument sounds but less acoustic. Additionally, these songs have sad and acoustic lyrics.
Cluster 3
These songs in cluster 3 contain high energetic songs with high beats and less acoustics and instrumentals. Moreover, they are a little happy songs. This type of song has the highest mean popularity and has a high chance of being on the Billboard chart.
Hierarchical Clustering
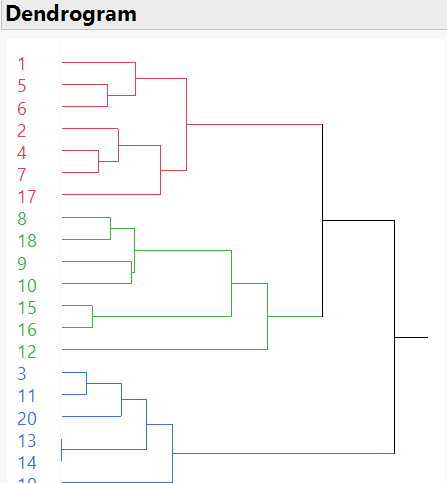
In hierarchical clustering analysis, the process begins by treating each data point as a single cluster and then iteratively merging the closest clusters based on a defined distance metric. As clusters unite, the dendrogram takes shape, reflecting the hierarchy and illustrating the fusion process step by step. Below is the dendrogram for hierarchical clustering using cosine similarity.
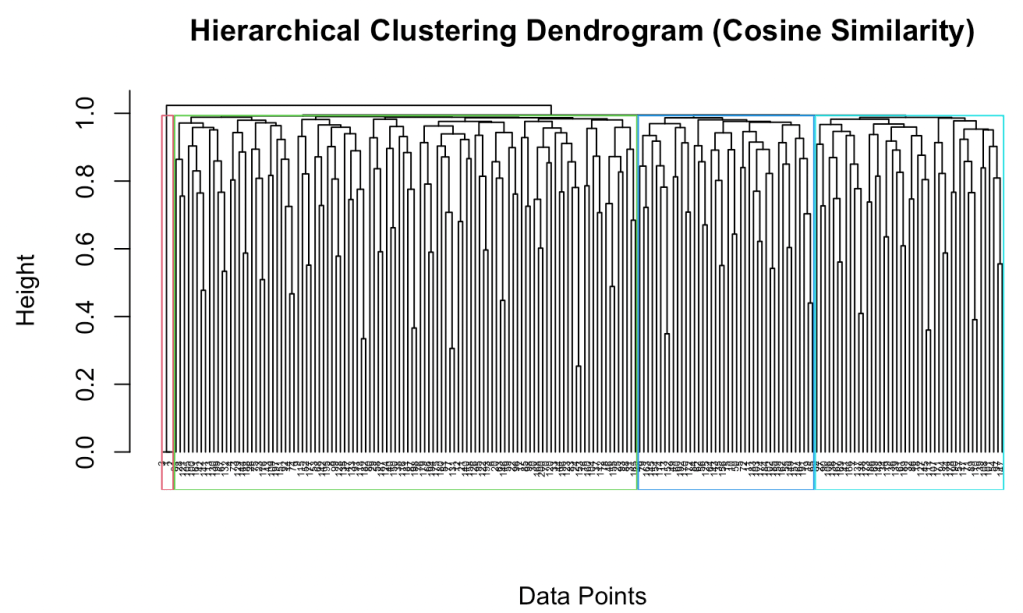
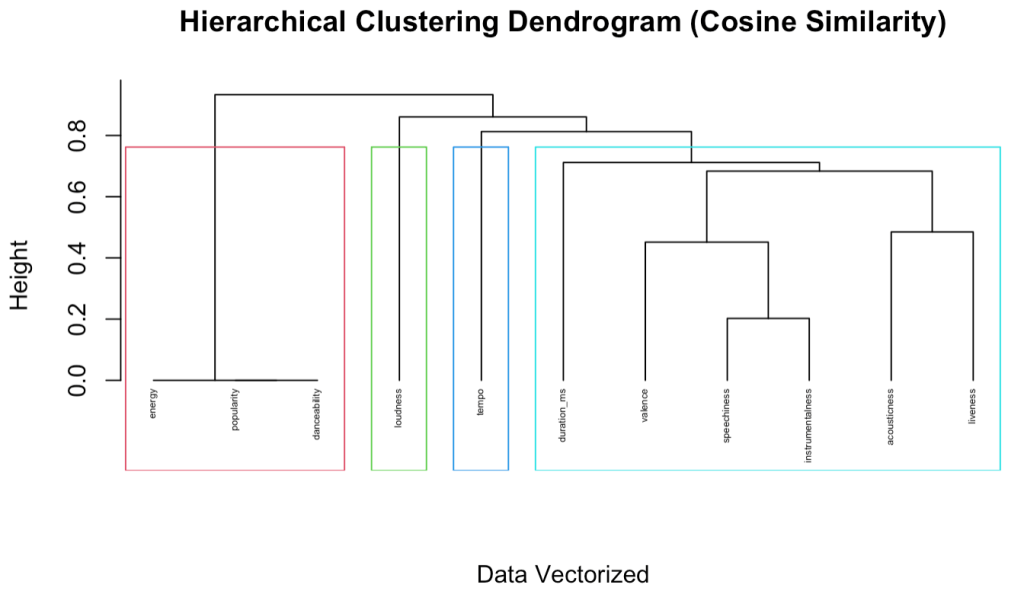
These dendrograms represent hierarchical clustering results. Clusters merge based on their proximity or similarity, forming higher-level clusters. The height at which the merging occurs helps to understand the level of dissimilarity or distance at which the clusters were merged. As can be seen from these figures above, the rectangular boxes suggest that the k-value should equal 4 as a suitable number of clusters. To more investigate, the cluster plot was created as below.
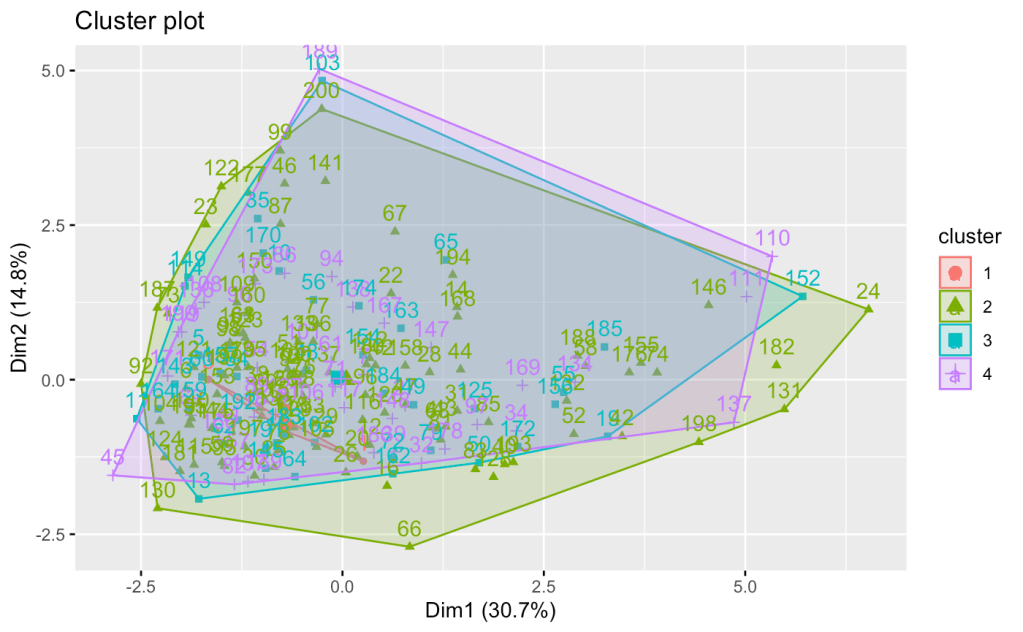
The plot above shows the cluster plot from the hierarchical clustering with k = 4. Although the dendrograms clearly represent the number of clusters, the plot turned out to be worse than the k-means method. This is because each cluster overlaps which is not seen in the data.
Conclusion
K-means clustering and hierarchical clustering are fundamental techniques in unsupervised machine learning and data analysis, especially in clustering and pattern recognition. Performing cluster analysis on Spotify data involves applying clustering algorithms to group similar music tracks based on various features extracted from the Spotify dataset. Clustering helps identify common characteristics within each cluster, providing insights into musical trends and preferences.
For example, a cluster with high danceability, energetic tempo, and loudness may represent upbeat or dance-oriented tracks. By examining the composition of clusters, insights into the preferences of different user groups can be gained. Users with similar listening habits may gravitate towards specific clusters, indicating distinct musical tastes. It can aid in playlist creation and recommendations by suggesting tracks that are similar to those a user already enjoys. Users can be presented with playlists containing tracks from the same cluster as their favorite songs.
To summarize, clustering analysis on Spotify data enables insights into musical traits and preferences by classifying music into meaningful groups based on criteria. This can be used to create playlists, make music suggestions, and gain a better understanding of customer trends and music preferences.
